
Traditional GTM metrics create more problems than they solve, with marketing obsessing over lead volume, sales chasing any deal regardless of long-term value, and customer success tracking retention in isolation from acquisition.
This fragmented approach leads to misaligned priorities, departmental finger-pointing, and executives struggling to identify which initiatives actually drive sustainable growth.
Cross-functional KPIs solve this by creating shared accountability across all teams and aligning them around the entire customer lifecycle. The result is better collaboration, improved customer experiences, shorter sales cycles, higher conversion rates, increased lifetime value, and clearer insights for strategic decision-making.
This post will share some shared OKRs and KPIs that’ll definitely drive alignment within your team.
Why Cross-Functional Metrics are Important
Shared KPIs break down these silos by creating mutual accountability and fostering collaborative decision-making.
When teams rally around common metrics that reflect the entire customer lifecycle, they naturally begin optimizing for collective success rather than individual department performance. This alignment translates directly into improved customer experiences, higher conversion rates, shorter sales cycles, and increased lifetime value.
Cross-functional metrics also provide executives with a clearer picture of GTM performance, enabling more strategic resource allocation and identifying bottlenecks that span multiple departments.
Most importantly, they create a shared language that facilitates better communication and coordination across the entire revenue organization.
10 Essential Cross-Functional KPIs for GTM Alignment
The following metrics will help your team naturally collaborate by measuring outcomes that span multiple departments. They will force teams to work together rather than optimizing for individual success at the expense of overall performance. These are the KPIs to share;
1. Customer Acquisition Cost (CAC) by Channel and Cohort
Customer Acquisition Cost (CAC) shouldn’t just be a marketing metric. This is because it’s a cross-functional metric that impacts Marketing, Sales, and Customer Success. When marketing teams realize that “quick and easy” leads actually cost 3x more once you factor in sales effort and lower conversion rates, they will naturally pivot toward higher-quality channels.
Sales teams can gain clarity on which leads need more nurturing versus those ready to buy, enabling them to tailor their approach and improve efficiency.
Meanwhile, Customer Success can link acquisition costs to churn patterns, identifying high-cost customers who may require extra onboarding to ensure long-term retention.
Tips for sharing this metric
- Let marketing lead the measurement of channel-specific costs and lead generation efficiency. However, this measurement should rely on sales data to capture the true cost of conversion.
- Customer Success should close the loop by tracking how different acquisition cohorts perform over time to ensure that the CAC reflects sustained value, not just initial conversions.
2. Marketing Qualified Lead (MQL) to Customer Conversion Rate
This metric exposes the reality behind lead quality promises. Marketing, for starters, is incentivized to refine targeting, messaging, and lead scoring to deliver prospects who genuinely match the ideal customer profile.
Sales teams, in turn, provide detailed feedback about why leads don't convert, helping marketing understand the gaps between perception and reality in their targeting. This creates a feedback loop where both teams continuously improve their handoff process and qualification criteria.
Tips for sharing this metric;
- Marketing owns the front end by defining what constitutes an MQL and optimizing lead generation processes to meet those standards.
- Sales owns the conversion process and provides important feedback on lead quality that informs marketing's ongoing optimization.
- Both teams share accountability for the overall conversion rate, creating natural collaboration in regular reviews where they analyze conversion patterns and identify improvement opportunities together.
3. Sales Velocity (Average Deal Size × Win Rate × Sales Cycle Length)
Sales velocity reveals how marketing's efforts directly impact sales performance beyond just lead volume.
When marketing launches a targeted campaign for enterprise prospects, the team can see how it affects all three components: larger deal sizes, higher win rates due to better targeting, and potentially shorter sales cycles through better-qualified prospects.
Sales teams gain insight into which marketing activities actually accelerate their pipeline, while marketing sees the downstream impact of their positioning and content strategies on deal progression and closure rates.
Tips for sharing this metric;
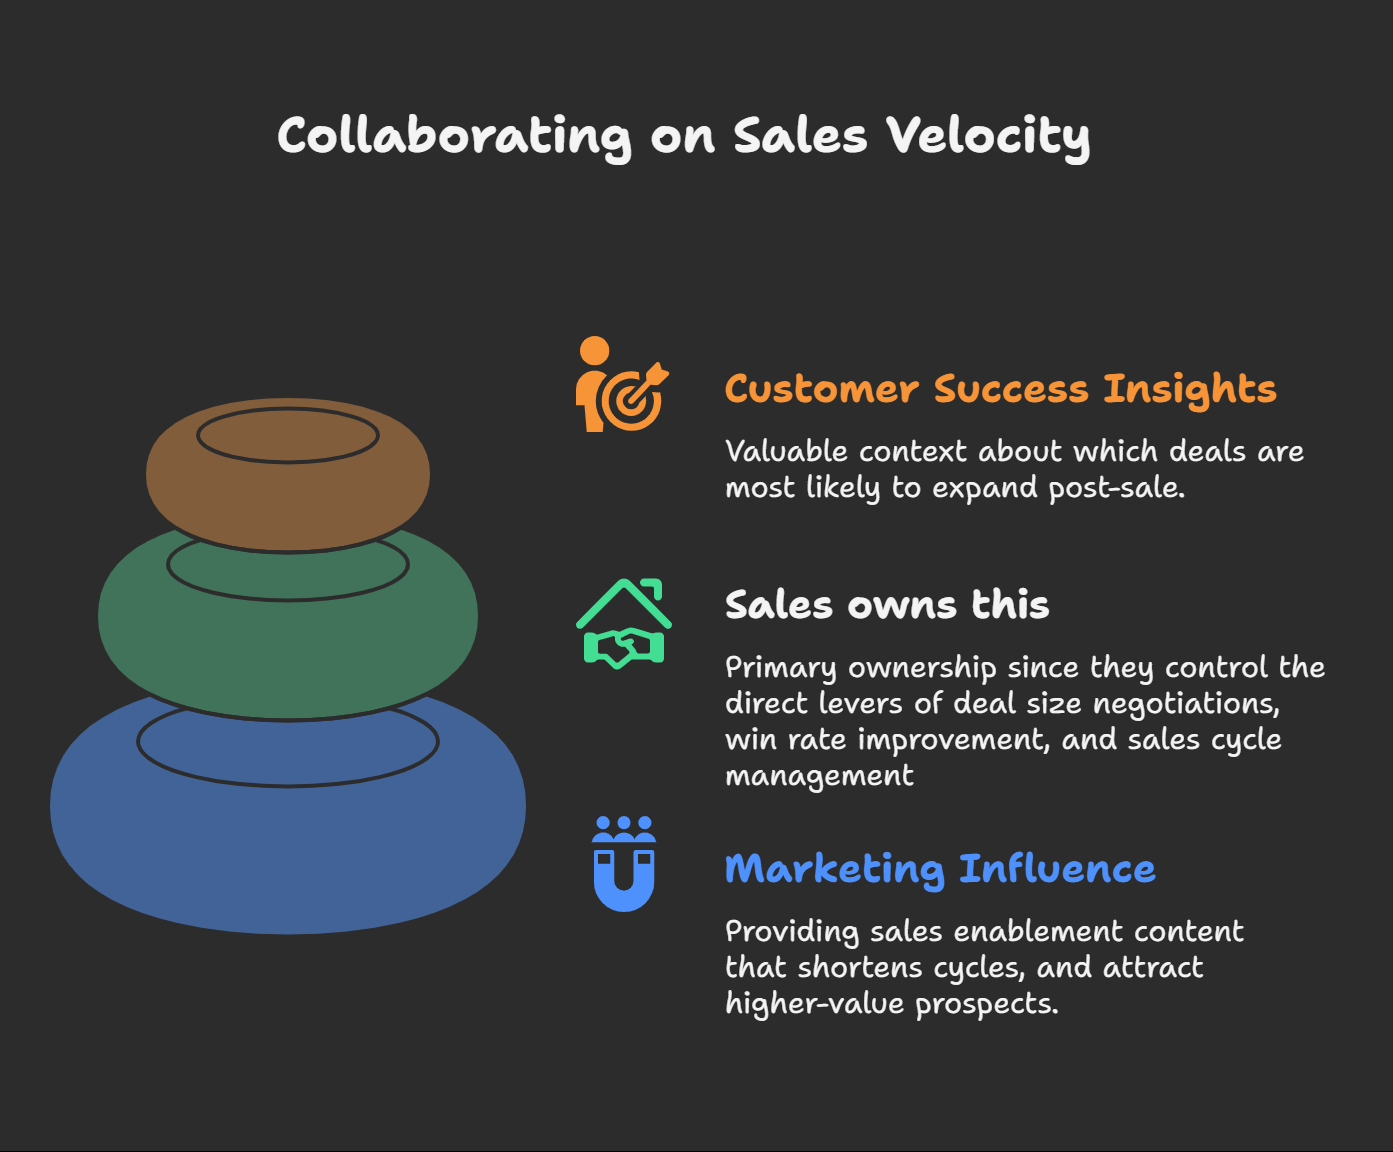
- Sales takes primary ownership since they control the direct levers of deal size negotiations, win rate improvement, and sales cycle management.
- Marketing contributes significantly by influencing prospect quality, providing sales enablement content that shortens cycles, and creating campaigns that attract higher-value prospects.
- Customer success adds valuable context about which deals are most likely to expand post-sale, helping sales prioritize opportunities that contribute to long-term improvements.
4. Net Revenue Retention (NRR)
NRR creates a direct connection between acquisition quality and long-term success, making marketing and sales accountable for the customers they bring in.
When NRR drops, teams can trace it back to specific acquisition sources or sales practices, revealing whether marketing attracted the less-than-ideal prospects or sales made unrealistic promises during the deal process.
This metric incentivizes marketing to focus on prospects with expansion potential, encourages sales to qualify more rigorously rather than just closing any deal, and gives customer success the authority to influence upstream processes that affect their ability to retain and grow accounts.
Tips for sharing this metric;
- Customer success leads NRR measurement and improvement initiatives since they directly manage retention and expansion activities.
- Sales teams should invest in the metric because it reflects the quality of deals they close and their accuracy in setting customer expectations.
- Marketing contributes by analyzing which acquisition sources and campaigns produce customers with higher NRR, then adjusting targeting and messaging to attract more expansion-ready prospects.
The shared nature of this metric means all teams regularly collaborate on identifying and addressing factors that impact long-term customer value.
5. Time to Value (TTV)
TTV exposes disconnects between marketing promises, sales commitments, and actual product delivery.
When customers take 6 months to see value despite being told they'd see results in 30 days, all three teams feel the impact. Marketing realizes their messaging may be creating unrealistic expectations, sales understands they need to better qualify prospects and set appropriate timelines, and customer success gains leverage to request better handoffs and more realistic goal-setting during the sales process.
This metric naturally drives conversations about what "value" actually means to different customer segments.
Tips for sharing this metric;
- Customer success owns TTV measurement and optimization since they manage the onboarding process and value realization journey.
- Sales teams contribute by ensuring proper expectation setting during deals and providing detailed handoff information that helps customer success accelerate onboarding.
- Marketing supports by creating educational content that helps customers achieve value faster and by adjusting their messaging to align with realistic timelines.
All teams collaborate on defining what constitutes "value" for different customer segments and continuously refine the process to accelerate achievement of those outcomes.
6. Pipeline Velocity by Source
This metric reveals which marketing initiatives actually accelerate deals through the pipeline, not just generate initial interest.
Marketing teams discover that their expensive trade show leads might convert at higher rates and move faster than cheaper digital leads, changing their channel investment priorities.
Sales teams see concrete evidence of which marketing sources deliver prospects who are more engaged and ready to move forward, helping them prioritize follow-up activities and tailor their approach based on the lead source's typical behavior patterns.
Tips for sharing this metric;
- Marketing takes ownership of source attribution and measuring how different channels perform throughout the pipeline journey, requiring sophisticated tracking of touchpoints beyond first or last-touch models.
- Sales owns the pipeline progression data and provides insights into how leads from different sources behave during the sales process.
- Both teams collaborate regularly to analyze patterns. With marketing adjusting channel strategies based on sales feedback about lead quality and behavior, while sales adapts their approach based on marketing's insights about prospect engagement history.
7. Customer Health Score
A comprehensive health score breaks down silos by requiring all teams to contribute meaningful data about customer engagement and satisfaction.
Marketing sees how their post-sale content consumption correlates with retention, sales learns how their relationship-building efforts impact long-term account health, and customer success gains a more complete picture of account risk that includes historical sales interactions and marketing engagement patterns.
This shared visibility creates natural collaboration as teams realize their individual actions significantly impact the overall customer relationship.
Tips for sharing this metric;
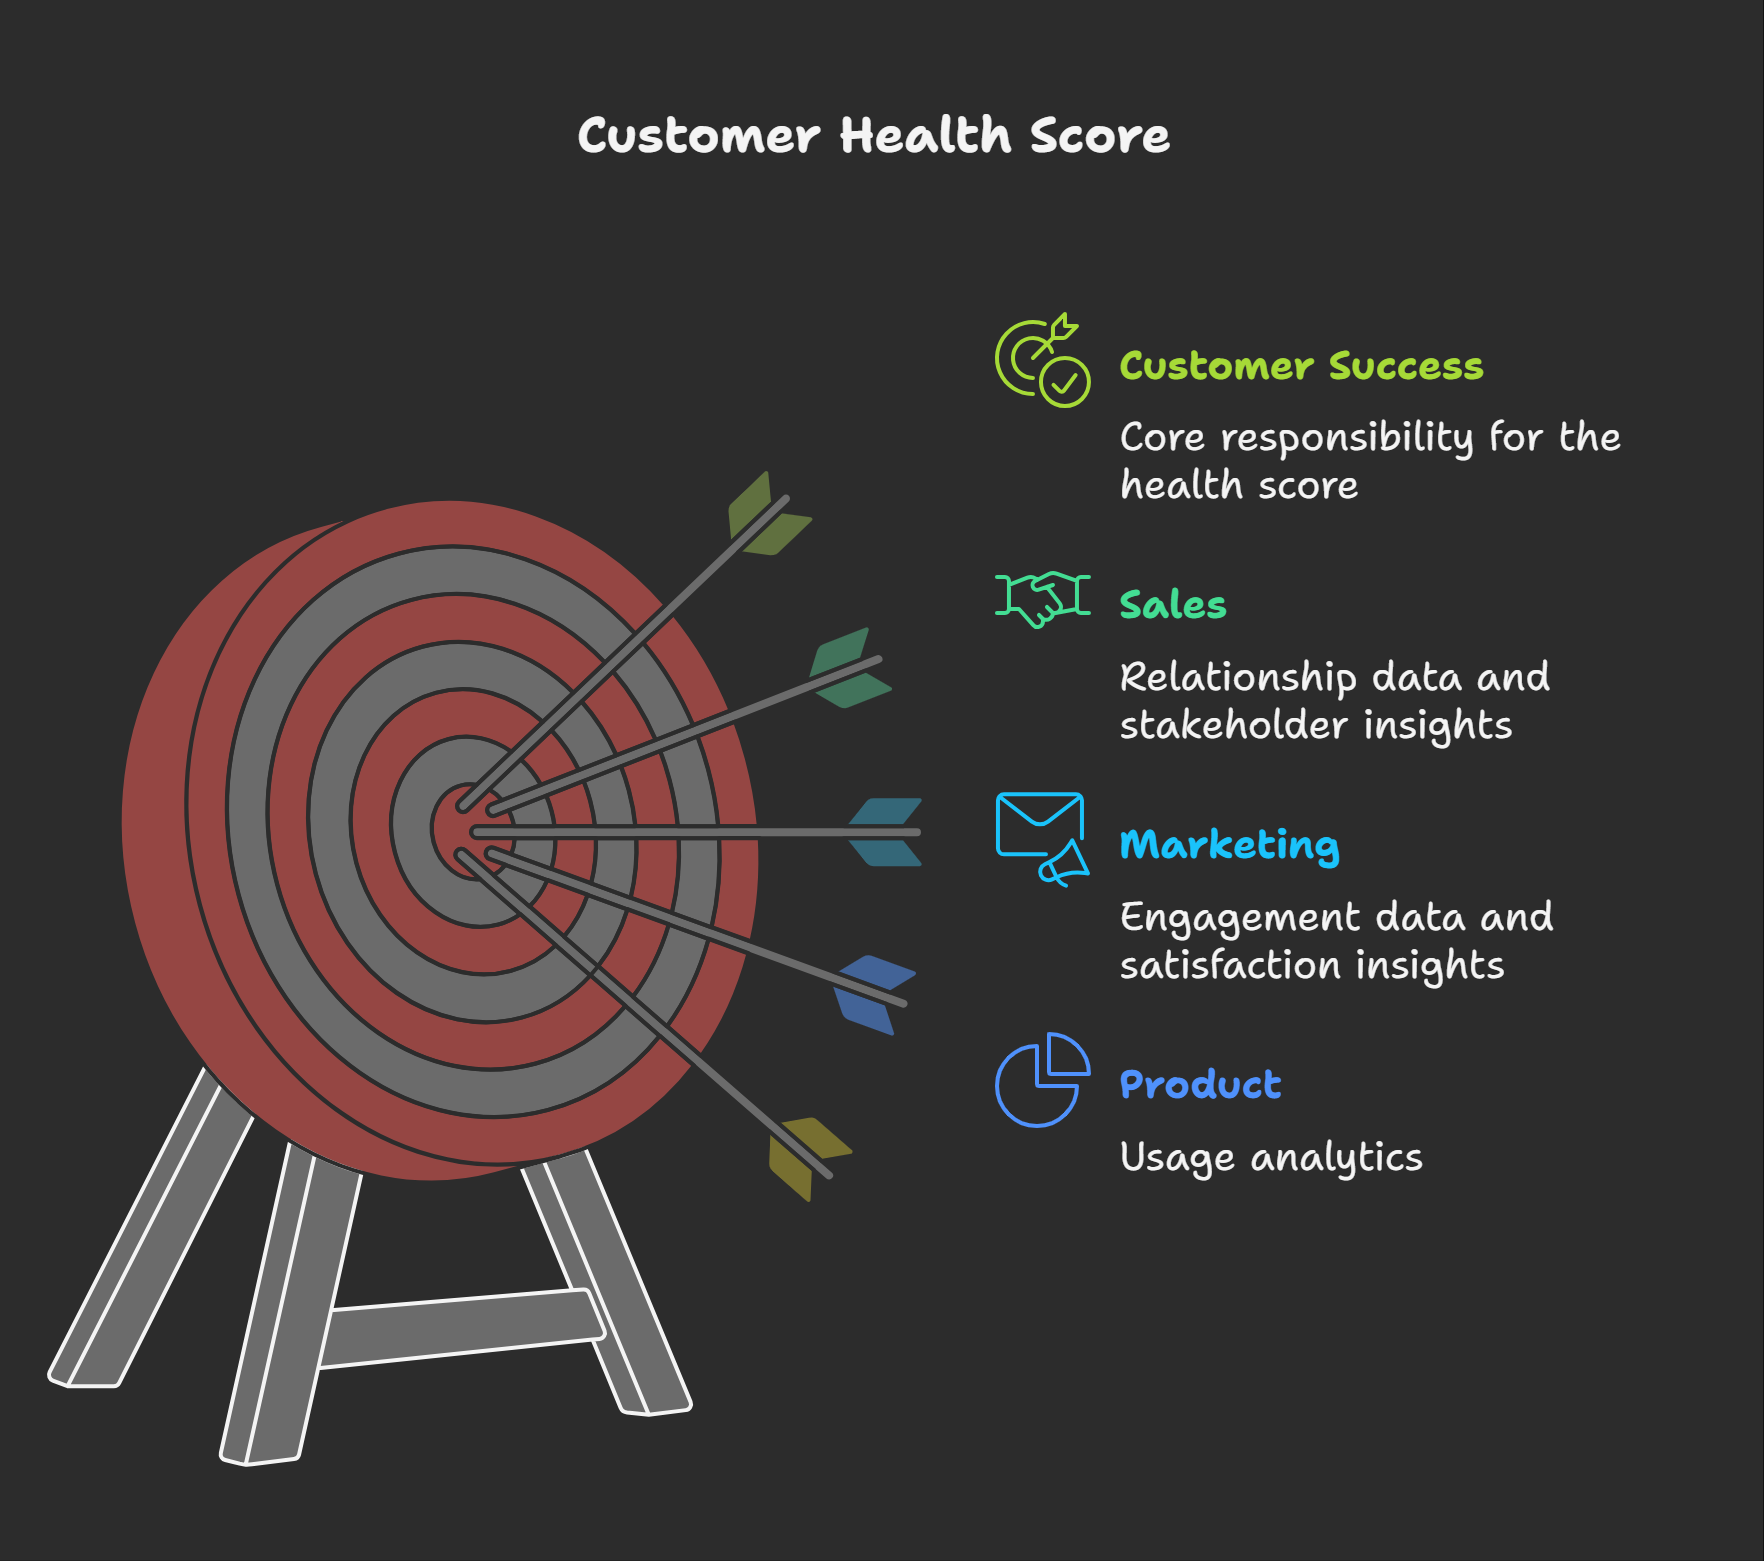
- Customer success owns the health score and ongoing optimization, but the score's effectiveness depends on data quality and insights from all teams.
- Sales contributes relationship data, communication history, and insights about stakeholder changes that might affect account health.
- Marketing provides engagement data from email campaigns, content, and event participation that indicate customer interest and satisfaction levels.
- Product teams add usage analytics, while support contributes ticket volume and sentiment data.
The health score becomes a collaborative tool where all teams regularly contribute insights and use the score to coordinate their customer interactions.
8. Cross-Sell and Upsell Conversion Rate
This metric reveals the compound effects of great customer relationships and targeted marketing.
Customer success teams can't succeed at expansion without marketing's support in nurturing existing customers with relevant content about additional products or features. Sales teams need customer success's insights about account health and usage patterns to time their expansion conversations appropriately.
When expansion rates are low, it triggers collaborative analysis: Are we targeting the right customers for expansion? Are we nurturing them with the right content? Are we approaching expansion conversations at the right time with the right stakeholders?
Tips for sharing this metric;
- Sales and customer success share ownership since successful expansion requires both relationship management and sales execution skills.
- Customer success identifies expansion opportunities through usage analysis, relationship health assessment, and regular customer conversations, then collaborates with sales on timing and approach.
- Marketing plays a supporting role by creating targeted campaigns for existing customers, developing expansion-focused content, and nurturing accounts that show expansion potential.
The three teams meet regularly to review the expansion pipeline, analyze successful patterns, and coordinate their efforts around high-potential accounts.
9. Customer Lifetime Value (CLV) by Acquisition Channel
CLV by channel transforms how teams evaluate marketing investments and customer acquisition strategies.
Marketing discovers that their most expensive channels might actually deliver the highest-value customers when factoring in expansion and retention, completely changing budget allocation priorities.
Sales learns which lead sources typically result in larger initial deals and higher expansion potential, helping them prioritize their time and tailor their approach.
Customer success gains valuable context about customer expectations and likely growth trajectories based on how customers were originally acquired, enabling more targeted success strategies
Tips for sharing this metric;
- Finance or Revenue Operations typically owns the CLV calculation to ensure consistency and accuracy across complex customer journeys. However, the metric's value comes from collaborative interpretation and action.
- Marketing uses CLV data to optimize channel investments and campaign targeting, often discovering counterintuitive insights about which channels deliver long-term value versus short-term conversions.
- Sales incorporates CLV insights into their prospecting and qualification processes, focusing more effort on channels that historically produce high-value customers.
- Customer success uses acquisition channel data to predict customer behavior and customize their onboarding and expansion approaches, while also providing feedback to marketing and sales about which customers tend to be most successful over time.
10. Feature Adoption Rate by Customer Segment
Feature adoption rates reveal whether marketing messaging, sales positioning, and customer success onboarding are all telling the same story about product value.
When customers aren't adopting features that were central to the sales pitch, it triggers collaborative investigation: Is marketing attracting customers who don't need those features? Are sales overselling capabilities? Is customer success not effectively guiding customers to value?
This metric creates a feedback loop where product usage data informs go-to-market strategy, messaging, and customer success methodology.
Tips for sharing this metric;
- Product and customer success jointly own the measurement since they have the most direct access to usage analytics and customer behavior data.
- Customer success drives adoption through onboarding, training, and ongoing engagement, making them accountable for helping customers realize value from key features.
- Marketing uses adoption insights to refine their messaging and create content that promotes high-value feature usage, while also adjusting their targeting to attract customers more likely to adopt important features.
- Sales incorporates adoption data into their positioning and demo strategies, focusing on features that customers actually use successfully rather than just features that sound impressive in presentations.
All teams collaborate regularly to analyze adoption patterns and coordinate efforts to drive usage of features that correlate with customer success and retention.
How to Implement Cross-Functional KPIs Successfully
Successful implementation requires more than just choosing the right metrics. Organizations need to establish regular cross-functional review meetings, create shared dashboards accessible to all teams, and align compensation structures to reward collaborative outcomes rather than individual department performance.
Leadership commitment is also important because executives must model collaborative behavior and resist the temptation to revert to departmental metrics during challenging periods.
Additionally, teams need shared definitions for key terms, standardized attribution models, and clear processes for data collection and analysis.
Not sure where to start? Book a free session with Stellafai, and we’d be happy to help you figure all of it out.

.png)
.png)
.png)